
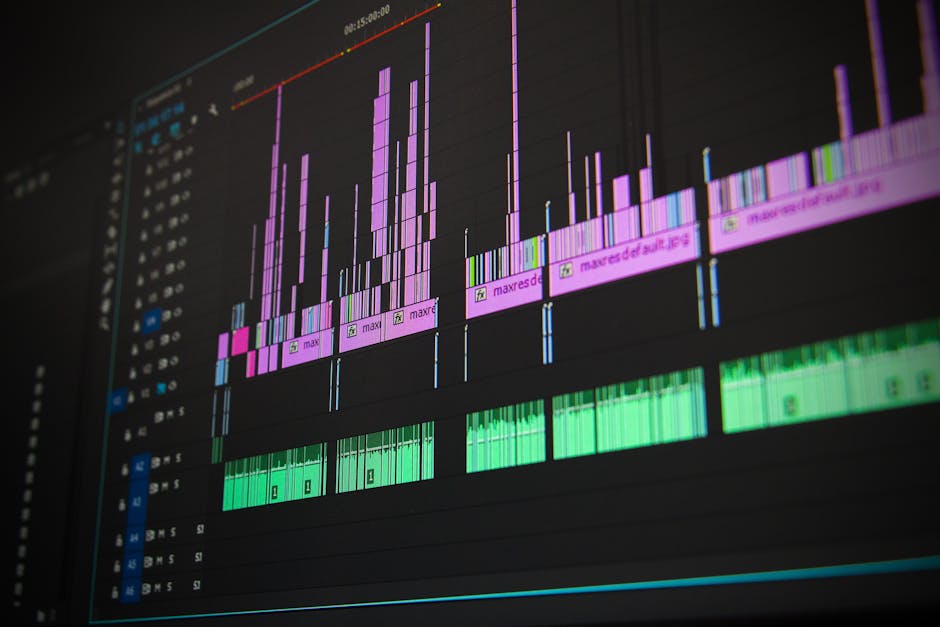
Have you ever wondered what your favorite song looks like? Audio waveform visualization gives you a chance to see the magic behind the music.
It’s like watching sound dance across a screen, turning invisible melodies into captivating visuals. Imagine being able to understand sound better, whether you’re creating music or just curious about how it works. With waveform visualization, you get an insight into the rhythm, beats, and energy of the audio you love.
This powerful tool can transform the way you experience sound, making it not only something you hear but also something you can see. Keep reading to discover how audio waveform visualization can enhance your understanding and appreciation of music and sound.
The Basics Of Audio Waveforms
Audio waveform visualization is a fascinating topic for music lovers and audio enthusiasts. It shows sound in a visual form, making it easier to understand. This technique helps in analyzing and editing audio files effectively. By understanding the basics, you can enhance your audio projects and enjoy a deeper connection with sound. Let’s dive into what audio waveforms are and how they represent sound.
What Are Audio Waveforms?
Audio waveforms are graphical representations of sound waves. They depict how sound travels through air or other mediums. Each waveform shows the unique characteristics of the sound. The shape of a waveform can tell you about the pitch, volume, and quality of the audio. Visualizing audio helps in identifying patterns and making precise edits.
How Waveforms Represent Sound
Waveforms represent sound by showing variations in air pressure over time. Each peak and trough in a waveform corresponds to changes in sound intensity. Peaks represent loud sounds, while troughs indicate softer sounds. This visual form makes it easier to spot issues like clipping or distortion. Different sounds create different waveform shapes, allowing for detailed audio analysis.

Credit: stackoverflow.com
Types Of Waveform Visualizations
Explore various types of audio waveform visualizations like linear, circular, and 3D. Each style offers a unique way to visually interpret sound waves, enhancing audio experiences across different platforms.
Audio waveform visualization is a fascinating way to observe sound. It’s not just for scientists or engineers. It can be incredibly useful for anyone interested in music production, audio editing, or even podcasting. Understanding different types of waveform visualizations can enhance your ability to interpret sound data. Let’s dive into some popular visualization types and see how each can be valuable in your audio journey.Oscilloscope Displays
Oscilloscope displays are perhaps the most traditional form of waveform visualization. They show sound waves as a graph with time on one axis and amplitude on the other. If you’ve ever seen a heartbeat monitor, it’s a similar concept. You get a real-time view of how sound fluctuates over time. This helps you understand the dynamics of a particular track or sound. Next time you’re editing audio, try using an oscilloscope to spot inconsistencies or peaks in your audio file.Spectrogram Displays
Spectrogram displays take waveform visualization to another level by adding frequency information. Instead of just showing amplitude over time, they give you a visual map of how different frequencies are distributed in the sound. Imagine being able to pinpoint exactly where the bass drops or where the high notes spike. This type of visualization is excellent for analyzing complex audio files like music tracks or multi-layered recordings. Do you want to know where your audio file needs equalization? A spectrogram can be your go-to tool.3d Waveform Models
3D waveform models offer a unique perspective by adding depth to the visualization. Picture sound waves not just in two dimensions, but as a three-dimensional landscape. This can make it easier to grasp the intricacies of audio waves, especially in complex soundscapes. Visualizing sound in 3D can be particularly helpful for sound designers and those working in virtual reality audio. Have you ever thought about how sound interacts in a space? A 3D model lets you explore that concept visually. By understanding these types of waveform visualizations, you can better interpret and manipulate audio data. Which type are you most curious to try in your next project?Tools For Creating Waveform Visualizations
Audio waveform visualization transforms sound into captivating visuals. These visuals represent sound waves, showing peaks and troughs. Various tools create these dynamic visuals, enhancing audio experiences. They serve artists, musicians, and developers seeking detailed sound analysis. Below are some tools for crafting stunning waveform visuals.
Software Options
Several software tools assist in creating waveform visuals. Audacity is a popular choice. It offers free access and simple controls. Users can edit and visualize audio effortlessly. Adobe Audition provides advanced features. It suits professionals needing precision. For real-time analysis, Sonic Visualiser shines. It displays waveforms and spectral content. Perfect for deep audio exploration.
Hardware Devices
Hardware devices deliver accurate waveform visualization. Audio interfaces like Focusrite enhance sound clarity. They connect instruments and computers seamlessly. The Roland TR-8S drum machine visualizes audio in real time. DJs and producers use it for live performances. Some mixing consoles include waveform displays. These consoles allow precise sound adjustments. Hardware tools offer tactile interaction with audio.
Applications In Music Production
Audio waveform visualization helps music producers see sound. It shows the shape and intensity of audio files. This visual tool aids in editing, mixing, and mastering tracks efficiently.
Audio waveform visualization offers a fascinating dimension to music production that can significantly enhance creativity and efficiency. By transforming audio signals into visual representations, producers gain a new perspective on sound. This approach not only aids in editing and mixing but also elevates the overall production process. But how exactly can waveform visualization be applied in music production? Let’s explore some practical applications.Enhancing Audio Editing
Waveform visualization helps you identify specific parts of a track with precision. This means you can easily spot errors, such as unwanted noise or clipping, and address them quickly. Imagine working on a track late at night and realizing there’s a pesky pop in the vocal line. With visual cues, you can zoom into the waveform, find the exact moment of the pop, and edit it out smoothly. Visual waveforms also allow you to align beats and sync tracks seamlessly. This can be a game-changer when layering multiple instruments or vocals. Seeing the peaks and valleys helps you match elements perfectly, ensuring a polished final product.Visual Aids For Mixing
Mixing is an art, and waveform visualization acts like a canvas for sound balance. It provides an immediate understanding of the dynamics and intensity of a track. When adjusting levels, visual waveforms show you the volume fluctuations in real time. This helps you maintain consistency across different sections of the song. Waveform visualization also assists in identifying frequency clashes between instruments. By observing overlapping areas, you can make informed decisions on EQ adjustments, leading to a clearer mix. Are you often challenged by balancing vocals with background music? Waveform visualization offers a clear view of how elements interact, allowing you to achieve a harmonious blend effortlessly. Incorporating waveform visualization into your workflow can transform the way you produce music. It equips you with tools to craft soundscapes with precision and creativity. What will you discover next by seeing your music through a different lens?Impact On Live Performances
Audio waveform visualization is transforming live performances. The blend of sound and visuals creates an immersive experience. It enhances the atmosphere, making concerts unforgettable. This innovation is changing how audiences perceive music. Visual effects and audience engagement are key elements.
Visual Effects For Concerts
Concerts today offer stunning visual effects. Audio waveform visualization plays a big role. It syncs visuals with the music’s rhythm. Bright colors and dynamic patterns move with the sound. This captivates the audience’s attention. The stage becomes a canvas, painted with sound waves.
Laser shows and LED screens amplify the experience. They transform simple sound into a visual spectacle. Artists use waveform visuals to express their music’s emotion. It adds depth and meaning to live performances.
Interactive Audience Engagement
Waveform visualization boosts audience interaction. Fans feel more connected to the music. Real-time visuals react to the crowd’s energy. People can see their impact on the performance. This creates a sense of participation.
Some events allow audiences to influence the visuals. Apps and devices let them change patterns and colors. This makes concerts more interactive. It turns a passive experience into an active one. The crowd becomes part of the show. Their engagement enhances the performance.
Credit: www.researchgate.net
Waveforms In Digital Art
Audio waveform visualization transforms sound into captivating visuals. Artists use software to create stunning digital art based on sound waves. These visual representations enhance the viewer’s experience by linking audio and imagery seamlessly.
Waveforms in digital art are transforming how we perceive and interact with sound. Imagine standing in front of a piece of art that not only captivates your eyes but also resonates with your ears. This is the power of audio waveform visualization in the realm of digital art, where sound and sight merge to create immersive experiences.Incorporating Sound In Visual Art
Artists are finding innovative ways to add sound into their visual creations. Think about how a gentle breeze might look when translated into a visual pattern, or how a thunderstorm could be represented by sharp, jagged lines. By using waveform visualizations, creators can translate sound into shapes and colors, allowing viewers to “see” music or noise. Have you ever wondered how your favorite song might look as an artwork? Artists can now transform melodies into stunning visual displays, making the intangible tangible. These sound-infused artworks invite you to experience art in a multi-sensory way, where seeing becomes as enjoyable as listening.Creating Dynamic Art Installations
Dynamic art installations are bringing static spaces to life. By integrating waveforms, artists can make installations that change in response to sound. Imagine walking through an exhibit where the visuals shift based on the music playing in the background. This kind of art challenges traditional perceptions of what an art exhibit should be. It encourages interaction, urging you to engage not just with your eyes but with your ears. Could this be the future of art, where your presence and the sounds you bring with you alter the artwork itself? In these installations, sound isn’t just an addition; it’s a crucial element that defines the experience. This approach makes art more accessible and engaging, inviting everyone, regardless of their background, to connect with the artwork in their unique way. Waveforms in digital art are not just about aesthetics; they are about creating experiences. As technology continues to advance, what new possibilities might arise for artists and audiences alike?Future Trends In Waveform Visualization
The future of audio waveform visualization looks bright and innovative. Technology continues to evolve, and new trends are emerging. These trends promise to enhance the way we experience audio. Let’s explore some exciting future trends in waveform visualization.
Advancements In Ai And Machine Learning
AI and machine learning are transforming audio visualization. They analyze sound waves in real time. This technology can identify patterns and predict changes. AI can personalize the visualization experience. It adapts to user preferences and listening habits. Machine learning algorithms improve accuracy. They learn from vast amounts of data. This leads to more detailed and accurate waveforms.
Innovations In Virtual And Augmented Reality
Virtual and augmented reality introduce new dimensions to waveform visualization. Users can immerse themselves in a 3D audio environment. This makes the experience more interactive and engaging. Augmented reality overlays sound visuals onto the real world. This blend of realities offers unique experiences. The integration of sound and sight enhances understanding. It creates a deeper connection with audio content.
Credit: medium.com
Frequently Asked Questions
What Is Audio Waveform Visualization?
Audio waveform visualization represents sound waves visually, showing amplitude over time. It’s used in audio editing software for precise audio manipulation. By observing waveforms, users can identify patterns, silence, and noise in audio tracks. This helps in enhancing audio quality and editing efficiency.
How Does Audio Waveform Visualization Work?
Audio waveform visualization works by converting sound waves into visual graphs. These graphs display amplitude changes over time. Software interprets audio frequencies and generates corresponding visual patterns. This process aids in audio editing, allowing users to see sound details and make precise adjustments.
Why Use Audio Waveform Visualization?
Audio waveform visualization is crucial for audio editing and analysis. It helps identify sound patterns, silence, and noise. This visualization enhances editing precision and efficiency. Editors can make informed decisions, improving audio quality and creating seamless sound experiences.
Can Audio Waveform Visualization Improve Sound Editing?
Yes, audio waveform visualization improves sound editing significantly. It provides clear visual representation of sound waves, aiding precise edits. Editors can easily spot and correct audio issues. This visualization enhances audio quality, ensuring a professional sound output.
Conclusion
Audio waveform visualization offers clear insights into sound patterns. It simplifies complex audio analysis with visuals. Musicians and sound engineers find it essential. Beginners can easily grasp audio dynamics. This tool enhances understanding and creativity. It’s not just for professionals; anyone can explore sound visually.
Tools and software make it accessible for all. Experimenting with waveform visualization can deepen audio knowledge. Whether for music or podcasts, it helps refine sound quality. Dive into audio exploration. Discover the power of visualization in sound. Engage with your audio projects in new ways.
Let your sound journey begin today.